
Share of Voice in Influencer Marketing: What It Means and How Brands Can Track It
- Sanket Maheshwari
- Jul 14
- 7 min read

The campaign numbers look good. Engagement rate is up. Reach held strong. Then the CMO asks one question: Are we gaining ground on our main competitors, or losing it?
Nobody in the room has an answer. The report shows what the campaign produced in absolute terms. It doesn't show whether the category moved in the brand's favor while that campaign was running, or moved away from it.
That's the gap between measuring campaign performance and measuring market position. Engagement rate answers the first question. Share-of-voice marketing answers the second. For a brand running an influencer program that's meant to build category authority over time, only the second question tells you whether that's happening.
What Share of Voice Means in Influencer Marketing
In paid media, share of voice is usually based on advertising spend or impression share compared to other brands in the category. Influencer marketing is different. Brands don't usually know what competitors are spending, and impressions aren't measured consistently across platforms. That's why the share of voice in influencer marketing is better looked at as the share of conversations your brand owns across social media and creator content.
There are four ways to look at it.
Engagement Share
This tells you how much of the total engagement belongs to your brand. Add up the likes, comments, shares, and other engagement your brand receives from influencers and organic content, then compare that with the combined engagement of your competitors during the same period. If your brand earns 30% of the total engagement, your engagement share of voice is 30%.
Content Volume Share
Look at how much content is being created about your brand. This includes influencer posts, branded hashtags, and organic mentions. Then compare that with the total content created about competing brands.
Audience Reach Share
This looks at how many people your influencer campaigns reach compared with the total audience reached by competing brands over the same period.
Creator Partnership Share
Count how many creators in your category are actively working with your brand and compare that number with your competitors. This is one of the most overlooked metrics, but it often has a big impact on future reach and engagement.
Why Share of Voice Beats Absolute Engagement as a Strategy Metric
Absolute engagement metrics improve when campaigns improve. Share of voice improves when a brand improves faster than the surrounding category. Those aren't the same thing, and mixing them up tends to point strategy in the wrong direction.
Let's say your influencer campaign engagement increases by 20% over the last two quarters. That sounds like progress. But if competing brands improve by 40% during the same period, they're growing much faster than you are. Your campaign has improved, but your competitive position has gone backward. That's why looking at engagement alone can give the wrong impression.
Two situations show why this distinction matters in practice.
A competitor launches a new creator program. If a competitor enters the category's creator pool with a meaningful number of new partnerships, a brand's share of voice can decline even while its own campaign metrics stay flat. Tracking the share of voice catches this early. Tracking only a brand's own numbers doesn't catch it at all.
A new product or category enters the market. When a new product or even a new category enters the market, things can change quickly. New brands often gain a share of voice more quickly because they're entering a growing space. That's why it's important to look at the overall category, not just your own numbers. If the category is expanding, your growth may need to be viewed differently.
How to Calculate Share of Voice for Influencer Campaigns
The calculation runs in four steps.
Step 1: Define the competitive set.
Three to ten brands competing for the same audience, not every brand loosely adjacent to the category.
Step 2: Collect the data across the same time window.
Engagement, content volume, reach, and creator partnerships were collected for every brand in the set over the same period.
Step 3: Calculate each brand's share.
Each metric is divided by the combined total across the competitive set for the brand and every competitor.
Step 4: Track direction over consecutive periods.
One snapshot shows the position. Several months of the same calculation show momentum.
CultureX's Listenings.ai Market Benchmark automatically pulls the comparative data for steps two and three. It stacks a brand against up to 10 competitors on followers, engagement rate, Social Score, and average views, with a six-month trajectory already built in and updated continuously rather than pulled each period manually.

Track your share of voice against up to 10 competitors in one view with a six-month trend. Explore CultureX's Listenings.ai Market Benchmark.
Adding the Creator Partnership Layer to Share of Voice
One of the first things to look at is the creator partnership share. If a brand works with more of the active creators in its category, it's likely to see more content published and better engagement over time. On the other hand, if that share starts dropping, content volume and engagement often follow.
It also helps spot competitor activity early. If a competitor starts partnering with more creators this month, you'll usually see the impact on engagement and content later. Creator partnership share gives you that signal before the results become obvious.
CultureX's Listenings.ai Influencer Map shows which creators different brands in your category have partnered with recently. This makes it easier to see how creators are distributed across competitors and whether your brand's share is growing or shrinking.

How Often to Measure Share of Voice, and What to Do With It
Monthly tracking is what gives you a trend worth acting on. A monthly calculation across four or five data points, engagement, content volume, reach, creator partnerships, and Social Score, produces something meaningful after about three months. Quarterly tracking is too slow to catch a category shift in time to respond.
When the share of voice declines across two or more consecutive months, it's time to find out what's changed. See whether competitors have expanded their creator partnerships, adopted higher-performing content formats, or whether your creator briefs need updating to better match what the audience is looking for.
When share of voice is growing, it is worth understanding which dimension is driving it, engagement share, creator partnership share, content volume share, so the same conditions can be maintained or scaled. Growth from engagement share alone is a different, more fragile situation than growth from engagement share and creator partnership share together. The second is far more durable.
CultureX's Listenings.ai Market Benchmark and Influencer Map cover the data for this monthly tracking without manually pulling numbers from each competitor's channels separately.
What a Share of Voice Dashboard Needs
A share-of-voice setup for influencer marketing only earns its keep if it includes these four things.
Competitive engagement rate, not only the brand's own. A brand's engagement rate sitting in the same view as its three to ten defined competitors, not a number reviewed in isolation.
Six-month trajectory, not a single snapshot. Trend direction is what enables a real strategic response. A snapshot shows where a brand stands today. A trend shows whether it's moving.
Creator partnership visibility per competitor. Which creators each competitor is actively working with, refreshed often enough to catch new partnerships before they've already produced a wave of content.
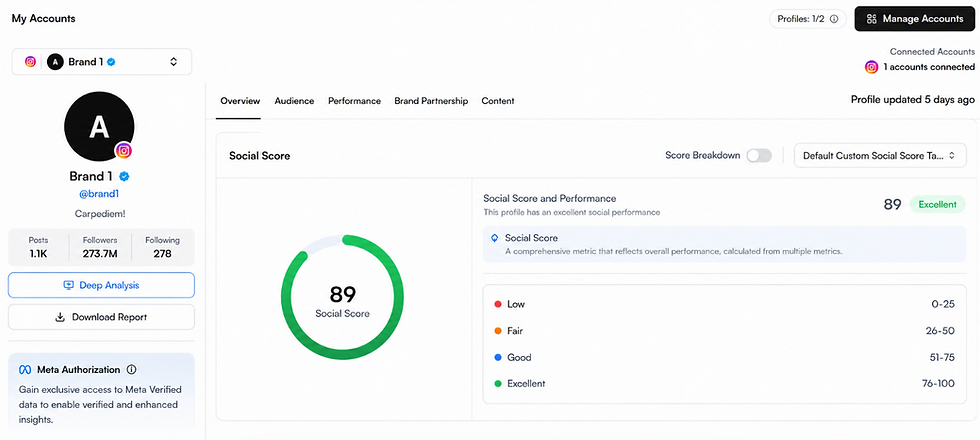
Social Score alongside engagement rate. Engagement rate can spike temporarily off one viral post. Social Score factors in engagement quality, audience authenticity, and growth consistency, which provides a steadier basis for competitive comparison. It's worth noting that these figures vary by brand and competitor set, so a comparison only means something when it's run against a brand's actual competitors, not a generic benchmark.
CultureX's Listenings.ai Market Benchmark and Influencer Map cover all four of these in one place, updated continuously, without needing manual data collection across competitor channels.
Brands that track only their own campaign metrics know how they're doing. Brands that track share of voice know whether the category is moving in their favor. That difference lies between optimizing a single campaign and building a position. For an influencer program meant to compound into category authority over time, share of voice is the metric that tells you whether the compounding is happening.
Ready to move from measuring campaigns to measuring market position? Start your free trial on CultureX.
FAQs
What is the share of voice in marketing?
Share of voice shows how visible your brand is compared to other brands in the same category. In influencer marketing, it's not just about your own campaign results. It looks at how your brand stacks up against competitors based on engagement, published content, reach, and the creators you're working with.
How is the share of voice calculated for influencer marketing?
Start by choosing a group of direct competitors, usually between three and ten brands. Then collect the same data for each brand over the same time period, including engagement, content volume, reach, and creator partnerships. Add up the totals for each metric and work out what share each brand has. Tracking this every month helps you see whether your position is improving or slipping over time.
What is the difference between share of voice and engagement rate?
Engagement rate tells you how well your own content performed. Share of voice tells you how visible your brand is compared to competitors. It's possible for your engagement rate to improve while your share of voice drops if other brands in your category are growing even faster.
How often should a brand measure share of voice?
Checking it once a month is usually enough. It helps you spot changes in your category, like a competitor working with new creators or a shift in content trends, before they become bigger problems. If you review it only quarterly, you may react much later than your competitors.
What data do I need to calculate the share of voice for social media?
To calculate share of voice, you'll need engagement data, audience reach, content volume, and creator partnership information for both your brand and your competitors. Just make sure you're comparing the same time period across all brands.
How do I track share of voice against competitors?
CultureX's Listenings.ai Market Benchmark compares your brand with up to 10 competitors. It tracks followers, engagement rate, Social Score, and average views, along with a six-month trend, so you can see how your position changes over time without manually collecting data every month.
What is the creator partnership share and why does it matter?
It's the share of a category's actively working creators that a brand is partnered with, relative to competitors. It matters because it's a leading indicator, changes here tend to show up in content volume and engagement share the following month, so tracking it catches competitor movement earlier than any other metric.
How does CultureX help brands track share of voice in influencer marketing?
CultureX combines Listenings.ai Market Benchmark with the Influencer Map to give brands a complete view of the market. You can compare engagement, Social Score, and creator partnerships across competitors from one dashboard instead of pulling data from multiple sources every month.


Comments